SAT Math lesson · Standard deviation
SAT standard deviation: comparing spread without computing
Standard deviation on SAT Math: compare the spread of two data sets from a dot plot or bar graph, the add vs. multiply rules, adding a value at the mean and distances in SD units. The SAT never asks you to compute one.
The core idea
Standard deviation measures how far values typically sit from the mean. Shifting every value by a constant leaves it unchanged, multiplying every value by k multiplies it by |k|, and values close to the mean make it smaller.
Core ideas
Words used here
- Mean: the average. Add the values and divide by how many there are.
- Deviation: how far one value is from the mean: value − mean. It is negative for values below the mean.
- Variance: the average of the squared deviations.
- Standard deviation (SD): the square root of the variance. It tells you how far the values typically are from the mean.
- Square root: √25 = 5 because 5 × 5 = 25.
- Constant: a fixed number, the same for every value.
- |k|: the absolute value of k, its size without the sign. |3| = 3 and |−3| = 3.
- Spread: how far apart the values are.
- The SD measures typical distance from the mean. If the values are far from the mean, the SD is big. If they are close to the mean, the SD is small.
- How to compute it: (1) find the mean, (2) find each deviation, (3) square each deviation, (4) average the squares to get the variance, (5) take the square root to get the SD. The SAT never asks you to compute one; knowing the steps tells you what makes it bigger or smaller.
- Add a constant c to every value: the SD does not change, because every gap stays the same.
- Multiply every value by k: the SD is multiplied by |k|. For example, × (−2) doubles the SD, because a distance can't be negative.
- Variance = SD². So if the SD is 3, the variance is 9.
- Adding a value close to the mean lowers the SD. Adding a value far from the mean raises it.
On the SAT.
- Compare, don't compute: SAT standard deviation questions show two data sets (dot plots, bar graphs or frequency tables) and ask which has the greater standard deviation, or how a change affects it. Look at how far the values sit from the middle.
- Shift and scale rules: adding the same number to every value leaves the SD unchanged; multiplying every value by k multiplies it by |k|.
- Related measures: the SAT also uses the range and the median for spread and center; see median and range.
Try it. Find the standard deviation of 7, 9, 10, 11, 13.
Show the answer
- Mean: 7 + 9 + 10 + 11 + 13 = 50, and 50 ÷ 5 = 10.
- Deviations: −3, −1, 0, 1, 3.
- Squares: 9, 1, 0, 1, 9. Their sum: 20.
- Variance: 20 ÷ 5 = 4.
- SD: √4 = 2.
Comparing SDs without computing
The standard deviation (SD) measures how far values are from the mean. To compare SDs, find each list's mean, then look at how far the values are from it. The list whose values are closer to its mean has the smaller SD.
Why it works. The SD averages squared distances, so values far from the mean count much more than values near it. In C, two values 20 away give 400 + 400 = 800. In A, the four values away from 30 give 400 + 100 + 100 + 400 = 1,000. So A is more spread out, even though both have the same range.
How to spot it: "which list has the greatest (or least) standard deviation?"
Example. Order these lists by standard deviation: A = {10, 20, 30, 40, 50}, B = {28, 29, 30, 31, 32}, C = {10, 30, 30, 30, 50}.
- Each list adds up to 150, so each mean is 150 ÷ 5 = 30.
- Distances from 30: A: 20, 10, 0, 10, 20. B: 2, 1, 0, 1, 2. C: 20, 0, 0, 0, 20.
- B's values are all very close to 30. C has two values far away, but three right at 30. A has four values away from 30.
- Order: B < C < A.
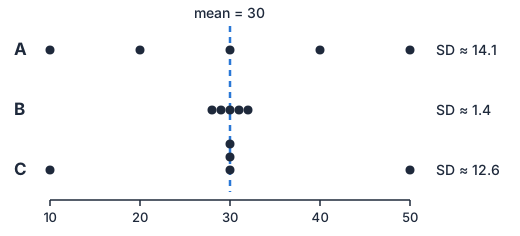
Trap: ranking A and C as equal because they have the same range (50 − 10 = 40).
Edge cases.
- Same range, different SD (A and C above).
- Same SD, different means: {1, 2, 3} and {101, 102, 103} have the same SD.
- SD = 0 only when every value is the same.
- Mirror images: a data set flipped end to end (frequencies 1, 3, 6 at the values 1, 2, 3, against 6, 3, 1) has the same SD, though its mean moves.
- Bar graphs and dot plots: two sets centered on the same value differ in SD by how much of each sits at the ends. More weight at the ends means a greater SD.
Harder example. Order by standard deviation: P = {2, 4, 6, 8, 10}, Q = {2, 2, 6, 10, 10}, R = {5, 6, 6, 6, 7}.
- Each list adds to 30, so each mean is 6.
- Distances from 6: P: 4, 2, 0, 2, 4. Q: 4, 4, 0, 4, 4. R: 1, 0, 0, 0, 1.
- R's values hug the mean. Q has four values at the largest distance, 4, while P has only two.
- Order: R < P < Q. (Variances: R 0.4, P 8, Q 12.8.)
Check yourself. Which has the larger SD, {1, 2, 3} or {10, 20, 30}?
Check your answer
{10, 20, 30}: it is the first list multiplied by 10, so its SD is 10 times as large.
Adding a constant vs. multiplying
The standard deviation (SD) depends only on the gaps between the values and the mean. Adding or subtracting a constant (the same number) moves every value and the mean together, so the gaps don't change. Multiplying every value by k stretches every gap by |k|, the size of k without its sign.
Why it works. The SD is built from the gaps (value − mean). Adding c moves every value and the mean by c, so each gap stays the same. Multiplying by k multiplies every gap by k; squaring and then taking the square root leaves the size |k|.
How to spot it: "every value is increased by…", "each value is doubled", a change of units.
Example. A list has SD 4. Every value is multiplied by 3 and then decreased by 5. What is the new SD?
- Multiply by 3: every gap becomes 3 times as big, so the SD becomes 4 × 3 = 12.
- Subtract 5: every value moves down by the same amount, so the SD stays 12.
- New SD: 12. (The variance is 12² = 144.)
Trap: subtracting 5 from the SD, or squaring the multiplier (that is what happens to the variance, not the SD).
Try it. A list has SD 6. Each value is divided by 2, and then 10 is added. What are the new SD and the new variance?
Show the answer
- Dividing by 2 is multiplying by 1/2, so the SD becomes 6 ÷ 2 = 3.
- Adding 10 doesn't change the SD.
- New SD: 3. New variance: 3² = 9.
Explore. Use "Add to every value": the dots slide together, so the mean and median move but the SD and range stay the same. Moving only the orange value changes the spread.
Sorted: 4, 6, 7, 9, 14 (5 values).
Mean = 40 ÷ 5 = 8. Median = 7. Range = 14 − 4 = 10. SD ≈ 3.41.
Move the orange value: the mean moves every time, the median moves only if the value crosses the middle, and the SD grows as the value moves away from the mean.
Add the same number to every value: the mean and median move by that number; the range and SD stay the same.
Edge cases.
- Multiplying by −1 mirrors the list; the SD stays the same.
- Multiplying by 0 gives SD 0.
- The variance is multiplied by k², not by k. The mean changes too: new mean = k × mean + c.
Harder example. A list has mean 40 and SD 5. Each value x is replaced by 2 − 0.5x. What are the new mean and SD?
- Mean: 2 − 0.5 × 40 = 2 − 20 = −18.
- SD: multiplying by −0.5 multiplies the SD by 0.5; adding 2 changes nothing. New SD: 0.5 × 5 = 2.5.
Check yourself. A list has SD 3. Every value is multiplied by −4 and then 7 is added. What is the new variance?
Check your answer
New SD: 4 × 3 = 12. New variance: 12² = 144.
Adding a value at the mean
The variance is the average of the squared deviations (distances from the mean), and the standard deviation (SD) is its square root. A new value equal to the mean adds 0 to the sum of squared deviations, but it adds 1 to the count. You divide the same total by a bigger number, so the SD gets smaller. A new value far from the mean makes the SD bigger.
Why it works. Variance = (sum of squared deviations) ÷ (count). A value at the mean adds 0 to the top and 1 to the bottom, so the fraction shrinks.
How to spot it: "a value equal to the mean is added", "two values are added".
A small case first. The list 2, 4, 6 has mean 4. Squared deviations: 4, 0, 4, total 8, so the variance is 8 ÷ 3 ≈ 2.67. Add a 4: the total is still 8, but now 8 ÷ 4 = 2. The variance (and so the SD) went down.
Example. A list of 9 values has mean 50. A tenth value of 50 is added. What happens to the mean and the SD?
- The mean stays 50: the new total is 9 × 50 + 50 = 500, and 500 ÷ 10 = 50.
- The squared deviations still add up to the same total, but now it is divided by 10 instead of 9.
- So the SD decreases. One exception: if all 9 values were already 50, the SD is 0 and stays 0. That special case is the only exception.
Trap: concluding that nothing changes because the mean is unchanged.
Edge cases.
- Two values added symmetrically, mean − d and mean + d, keep the mean. The SD goes down if d is less than the current SD, stays the same if d equals it, and goes up if d is greater. (The new variance is (n × SD² + 2d²) ÷ (n + 2).)
- A list whose SD is 0 stays at 0 when you add another copy of the mean.
Harder example. A list of 8 numbers has mean 30 and SD 4. The numbers 26 and 34 are added. What happens to the SD?
- 26 and 34 are both 4 from the mean, so the mean stays 30.
- Sum of squared deviations before: 8 × 4² = 128. The two new values add 16 + 16 = 32, so the sum is 160.
- New variance: 160 ÷ 10 = 16. New SD: √16 = 4.
- The SD stays the same, because the new values sit exactly 1 SD from the mean.
Check yourself. Four numbers have mean 50 and SD 10. The numbers 45 and 55 are added. Does the SD go up or down?
Check your answer
They are only 5 from the mean, less than the SD of 10, so the SD goes down: (4 × 100 + 25 + 25) ÷ 6 = 75, and √75 ≈ 8.66.
Distances in SD units
"k standard deviations above the mean" means mean + k × SD, where SD is the standard deviation. "k SDs below" means mean − k × SD. To ask how many SDs a value is from the mean, divide its distance from the mean by the SD.
Why it works. The SD is used as a ruler. "2 SDs" is a distance measured in SD-sized steps, so you multiply to go from SDs to a distance, and divide to go from a distance to SDs.
How to spot it: "within 2 standard deviations of the mean", "how many SDs above the mean".
Example. Scores have mean 60 and SD 8. What score is 2.5 SDs below the mean? How many SDs above the mean is a score of 76?
- 2.5 SDs = 2.5 × 8 = 20. Below the mean: 60 − 20 = 40.
- Distance of 76 from the mean: 76 − 60 = 16. In SDs: 16 ÷ 8 = 2 SDs above.
Within k SDs means on both sides. With mean 50 and SD 4, 2 SDs = 2 × 4 = 8. The values within 2 SDs run from 50 − 8 = 42 to 50 + 8 = 58. Counting both ends, that is 58 − 42 + 1 = 17 integers.
Trap: adding 2.5 to the mean instead of 2.5 × 8.
Try it. Test scores have mean 120 and SD 15. How many SDs below the mean is a score of 75?
Show the answer
- Distance: 120 − 75 = 45.
- In SDs: 45 ÷ 15 = 3 SDs below the mean.
Edge cases.
- "Within" means on both sides; "more than k SDs from the mean" means outside that band, on either side.
- SD units compare different scales. A score 2 SDs above the mean on one test beats a score 1.5 SDs above on another, whatever the raw numbers.
Harder example. Test A has mean 70 and SD 5. Test B has mean 600 and SD 50. Kim scored 82 on test A and 700 on test B. On which test did she do better compared with the other test-takers?
- Test A: 82 − 70 = 12 above the mean, which is 12 ÷ 5 = 2.4 SDs.
- Test B: 700 − 600 = 100 above the mean, which is 100 ÷ 50 = 2 SDs.
- 2.4 > 2, so she did better on test A.
Check yourself. Scores have mean 80 and SD 6. What score is 1.5 SDs above the mean?
Check your answer
80 + 1.5 × 6 = 80 + 9 = 89.
Computing variance and SD
The SAT doesn't ask you to compute a standard deviation; this section shows what the number measures, which helps when you compare spreads.
The variance is the average of the squared deviations (each value minus the mean, squared). The standard deviation (SD) is the square root of the variance. A small table keeps the work tidy.
Why it works. Squaring makes every deviation positive, so they can't cancel, and it gives large deviations more weight than small ones. The square root at the end brings the result back to the units of the data.
How to spot it: a short list and a question about the variance or the SD itself.
Example. What is the standard deviation of 3, 9, 11 and 17?
- Mean: 3 + 9 + 11 + 17 = 40, and 40 ÷ 4 = 10.
- Fill in the table:
| Value | Deviation (value − 10) | Squared deviation |
|---|---|---|
| 3 | −7 | 49 |
| 9 | −1 | 1 |
| 11 | 1 | 1 |
| 17 | 7 | 49 |
| Sum: 0 | Sum: 100 |
- Variance: 100 ÷ 4 = 25.
- SD: √25 = 5.
Trap: averaging the plain deviations. They always add up to 0, which is why we square them first.
Edge cases.
- A shortcut: variance = (mean of the squares) − (mean)². For 3, 9, 11, 17: (9 + 81 + 121 + 289) ÷ 4 − 10² = 125 − 100 = 25 ✓.
- Divide by n, the number of values, for the population standard deviation used here.
- Units. If the data are in meters, the SD is in meters and the variance in square meters.
Harder example. The list 1, 5, x, 9 has mean 6. What is its variance?
- The total must be 4 × 6 = 24, so x = 24 − 15 = 9. The list is 1, 5, 9, 9.
- Deviations from 6: −5, −1, 3, 3.
- Squares: 25, 1, 9, 9. Sum: 44.
- Variance: 44 ÷ 4 = 11 (so the SD is √11 ≈ 3.32).
Check yourself. What is the SD of 2 and 8?
Check your answer
Mean 5, deviations −3 and 3, squares 9 and 9, variance 9, so the SD is 3.
How hard questions disguise it
For harder questions (L4–L5)
L4 versions ask which change to a list increases the SD the most, or describe a change in words ("each employee gets a $2,000 raise"). L5 versions mix SD with the mean and median: a $2,000 raise for everyone moves the mean and median but not the SD, while a 10% raise for everyone multiplies all three by 1.1. See the averages and median and range lessons for the center measures. Ask yourself: does this change shift the values, or stretch the gaps?
Practice
Practice standard deviation questions in timed sets on the standard deviation practice page.
Common traps
Judging spread by the wrong feature
Standard deviation is about how far values sit from their own mean. A set with more values at the ends has the greater SD; a set flipped end to end has the same SD; no computing is needed to compare.
Thinking adding a constant changes the SD
Adding the same number to every value slides the whole list without changing the gaps. The standard deviation stays the same, and the amount added is not a measure of spread.
Ignoring or misapplying a multiplier
Multiplying every value by k, as in a unit conversion, stretches every distance from the mean by k, so the SD is multiplied by k. Converting to a smaller unit makes the number larger.
Confusing standard deviation with variance
Variance is the SD squared: a multiplier k scales the variance by k² but the SD by k, and you take a square root to get back from variance to SD.
Thinking a value at the mean doesn't lower the SD
A new value equal to the mean adds nothing to the squared distances but adds to the count, so the SD goes down.
Computing a different measure than the SD
The SD squares every distance from the mean, averages the squares, then takes the square root. The mean, the range, the largest distance and the average plain distance are all different numbers.
Converting to standard-deviation units wrong
'2.5 SDs below a mean of 60, with SD 8' is 60 − 2.5 × 8 = 40. Multiply by the SD, use the right direction, and report the value, not just the distance.
Counting the values within k SDs wrong
Within 2 SDs of a mean of 50 with SD 4 runs from 42 to 58, on both sides of the mean, inclusive. That's 58 − 42 + 1 = 17 integers.
Judging spread by the range alone
Two lists with the same range can have different SDs. Look at how close most values are to the mean, not only at the extremes.
Scaling the SD by a negative number
Under x → kx + c the mean becomes k × mean + c, but the SD becomes |k| × SD: a shift doesn't change spread, and spread is never negative.