SAT Math lesson · Median & range
SAT median, mode and range: sorting, outliers and frequency tables
Median, mode and range on SAT Math: medians of odd and even lists, how removing an outlier moves the mean and the median, ranges of combined data sets, and medians from frequency tables.
The core idea
The median is the middle of a sorted list (the average of the two middle values when the count is even), the mode is the most frequent value, and the range is greatest minus least. Always sort first, and when a value is unknown, consider every position it could take.
Core ideas
Words used here
- Sorted list: the values written in order, from least to greatest.
- Median: the middle value of a sorted list.
- Mode: the value that appears most often. A unique mode means only one value has the highest count.
- Range: the greatest value minus the least value. It measures how spread out the list is.
- Mean (average): the sum of the values divided by how many values there are.
- Outlier: a value far above or far below the others.
- Frequency: how many times a value appears. A frequency table lists each value with its frequency.
- Position: the place of a value in the sorted list (1st, 2nd, 3rd, …).
- Median: sort the list first. With an odd number of values, the median is the single middle value. With an even number, it is the average of the two middle values.
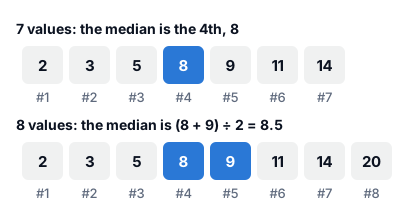
- Where the middle is: in a sorted list of n values, the median is at position (n + 1) ÷ 2. For 7 values, (7 + 1) ÷ 2 = 4, so the 4th value. For 8 values, (8 + 1) ÷ 2 = 4.5, so halfway between the 4th and 5th values.
- Mode: the most frequent value. A list can have several modes, or none if every value appears once.
- Range: greatest − least.
- Mean vs. median: one very large value (an outlier) pulls the mean up a lot, but it hardly moves the median.
On the SAT.
- Data displays: SAT median questions often give a dot plot, a frequency table or a bar graph. Add the frequencies to find how many values there are, then count to the middle.
- Outliers: "If the value 111 is removed, how do the mean and the median change?" is a classic. The mean moves; check the middle to see whether the median does.
- Typed answers: a median of an even-length list can end in .5: type it exactly (13.5).
Try it. For the list 7, 2, 9, 4, 9, 12, find the median, the mode and the range.
Show the answer
- Sorted: 2, 4, 7, 9, 9, 12. There are 6 values, an even number.
- Median: the two middle values are 7 and 9, so (7 + 9) ÷ 2 = 16 ÷ 2 = 8.
- Mode: 9 appears twice, every other value once, so the mode is 9.
- Range: 12 − 2 = 10.
Median of an odd-length list
Sort the values from least to greatest. The median is the single value in the middle.
Why it works. The median splits a sorted list into two halves of equal size. Sorting is what makes "middle" mean the middle value rather than the middle position on the page.
How to spot it: an odd number of values.
Example. What is the median of 13, 4, 21, 8, 17, 6, 10?
- Sorted: 4, 6, 8, 10, 13, 17, 21.
- There are 7 values. The middle position is (7 + 1) ÷ 2 = 4.
- The 4th value is 10.
Trap: picking the middle of the unsorted list, 8.
Edge cases.
- Repeated values each take a position. The median of 3, 3, 3, 8, 9 is 3.
- Negatives sort below zero: −5 comes before −2.
- Changing the extremes doesn't move the median, as long as they stay the extremes.
Harder example. The list 12, 7, x, 15, 3 has a median of 7. What is the greatest possible value of x?
- Without x, the sorted values are 3, 7, 12, 15. With x there are 5 values, so the median is the 3rd.
- If x ≤ 7, the sorted list has 7 in 3rd place (for example 3, x, 7, 12, 15 or x, 3, 7, 12, 15). The median is 7 ✓.
- If x > 7, the 3rd value becomes x or 12, which is more than 7 ✗.
- So x ≤ 7, and the greatest possible value is 7 (then the list is 3, 7, 7, 12, 15).
Check yourself. What is the median of 5, −2, 0, 8, −2, 3, 11?
Check your answer
Sorted: −2, −2, 0, 3, 5, 8, 11. The 4th of 7 values is 3.
Median of an even-length list
Sort the values. With an even number of values there are two middle values, and the median is their average.
Why it works. With an even count, no single value sits in the middle. The point halfway between the two middle values splits the list into two halves of equal size, so that is the median.
How to spot it: an even number of values.
Example. What is the median of 14, 3, 9, 21, 7, 12, 5, 18?
- Sorted: 3, 5, 7, 9, 12, 14, 18, 21.
- There are 8 values, so the middle pair is the 4th and 5th values: 9 and 12.
- Median: (9 + 12) ÷ 2 = 21 ÷ 2 = 10.5.
When an unknown is one of the middle values, set their average equal to the median and solve. If x and 12 are the middle pair and the median is 10, then (x + 12) ÷ 2 = 10. Multiply both sides by 2: x + 12 = 20, so x = 8.
Trap: answering 9 or 12, only one of the two middle values.
Edge cases.
- The median may not be in the list: 10.5 above.
- If the two middle values are equal, the median is that value.
- An unknown can move into the middle. Try each place it could sit in the sorted list (see the example).
Harder example. A list of six numbers is 2, 5, 7, 12, 14 and x. Its median equals its mean. What are the possible values of x?
- The mean is (40 + x) ÷ 6, because 2 + 5 + 7 + 12 + 14 = 40.
- If x ≤ 5, the middle pair is 5 and 7, so the median is 6: (40 + x) ÷ 6 = 6 gives x = −4. That is ≤ 5 ✓.
- If 5 ≤ x ≤ 12, x is in the middle pair with 7: (x + 7) ÷ 2 = (40 + x) ÷ 6 gives 3x + 21 = 40 + x, so x = 9.5. It is between 7 and 12 ✓.
- If x ≥ 12, the middle pair is 7 and 12, so the median is 9.5: (40 + x) ÷ 6 = 9.5 gives x = 17. That is ≥ 12 ✓.
- x = −4, 9.5 or 17.
- Check x = 17: the list 2, 5, 7, 12, 14, 17 has median 9.5 and mean 57 ÷ 6 = 9.5 ✓.
Check yourself. What is the median of 1, 3, 3, 6, 8, 9?
Check your answer
The 3rd and 4th values are 3 and 6, so the median is (3 + 6) ÷ 2 = 4.5.
The mode
The mode is the value that appears most often. Count how many times each value appears. If an unknown value must create a particular mode, the unknown has to equal that value.
Why it works. The mode depends on counts, not on sizes. The only way to change it is to change how often values appear, which is why an unknown that must create a mode has to copy a value.
How to spot it: "most frequent", "unique mode" (only one value appears the most times).
Example. The list 4, 9, x, 6, 9, 4, 2, 11 has a unique mode of 4. What is its median?
- Without x, both 4 and 9 appear twice. For 4 to be the only mode, x must be 4 (then 4 appears three times).
- Sorted: 2, 4, 4, 4, 6, 9, 9, 11. There are 8 values.
- The 4th and 5th values are 4 and 6, so the median is (4 + 6) ÷ 2 = 5.
Trap: answering 4, the mode, when the question asks for the median.
Edge cases.
- No mode: every value appears once. Two modes: two values tie for most often.
- A unique mode needs strictly more copies than any other value.
- The mode can be any value, even the smallest or the largest.
Harder example. The list 3, 5, 5, 8, x, y has a unique mode of 8. Which is greater, its mean or its median?
- 5 already appears twice, so 8 must appear at least 3 times: x = 8 and y = 8.
- The list is 3, 5, 5, 8, 8, 8.
- Median: the 3rd and 4th values are 5 and 8, so (5 + 8) ÷ 2 = 6.5.
- Mean: 37 ÷ 6 ≈ 6.17.
- The median is greater.
Check yourself. What is the least number of 7s you must add to 2, 4, 4, 7, 9, 9 to make 7 the unique mode?
Check your answer
4 and 9 each appear twice. 7 needs 3 copies, and it has 1, so add 2.
Mean vs. median
You can often compare the mean (average) and the median without much arithmetic. A value far above the rest pulls the mean up. A value far below the rest pulls the mean down. In a symmetric list (values spread the same way on both sides of the middle, such as 3, 5, 7, 9, 11), the mean equals the median.
Why it works. The mean uses the size of every value; the median uses only the middle position. Making the largest value even larger changes the total, but not the order, so only the mean moves.
How to spot it: "which is greater, the mean or the median?", or a list with one outlier.
Example. For the list 2, 3, 3, 4, 28, which is greater, the mean or the median?
- Median: the list is already sorted, and the 3rd of 5 values is 3.
- Mean: 2 + 3 + 3 + 4 + 28 = 40, and 40 ÷ 5 = 8.
- The mean is greater. The outlier 28 pulls it up.
Trap: assuming the mean and the median are always close.
Explore. This is the example list 2, 3, 3, 4, 28. Drag the outlier (orange) and watch: the mean follows it, the median stays at 3 until the value moves into the middle.
Sorted: 2, 3, 3, 4, 28 (5 values).
Mean = 40 ÷ 5 = 8. Median = 3. Range = 28 − 2 = 26. SD ≈ 10.02.
Move the orange value: the mean moves every time, the median moves only if the value crosses the middle, and the SD grows as the value moves away from the mean.
Add the same number to every value: the mean and median move by that number; the range and SD stay the same.
Edge cases.
- Adding the same number to every value moves the mean and the median by that number.
- Moving one value without crossing the middle changes the mean only.
- Outliers on both sides can balance, leaving the mean close to the median.
Harder example. A list of 9 numbers has mean 20 and median 18. The largest number is increased by 27 and the smallest is decreased by 9. What are the new mean and median?
- Total before: 9 × 20 = 180. Change: +27 − 9 = +18. New total: 198.
- New mean: 198 ÷ 9 = 22.
- The largest value only got larger, and the smallest only got smaller, so the sorted order of the middle values is unchanged. The 5th value is still 18.
- New median: 18.
Check yourself. In 10, 20, 30, 40, 50, the 50 becomes 100. Which changes: the mean, the median, or both?
Check your answer
Only the mean (from 30 to 40). The median stays 30.
Removing an outlier. Take the list 20, 22, 34, 37, 41, 41, 111 and remove 111.
- Mean: 306 ÷ 7 ≈ 43.7 before, 195 ÷ 6 = 32.5 after. The mean decreases, a lot.
- Median: the 4th of 7 values, 37, before; the average of the 3rd and 4th of 6, (34 + 37) ÷ 2 = 35.5, after. The median decreases a little.
- In 21, 22, 35, 37, 40, 40, 40, 44, 45, 90, removing 90 leaves the median at 40: the two middle values were both 40, and the new middle value is 40 too. The mean still decreases.
Range with an unknown
The range is greatest − least. An unknown value x might be the new greatest value, the new least value, or somewhere in between. Test each case.
Why it works. The range depends only on the two extremes. An unknown changes the range only if it becomes a new greatest or a new least value.
How to spot it: "the range of the list is r; what could x be?"
Example. The list 8, 15, 4, x, 11 has a range of 14. What are the possible values of x?
- Without x, the least value is 4 and the greatest is 15.
- If x is the greatest: x − 4 = 14, so x = 18.
- If x is the least: 15 − x = 14, so x = 1.
- If x is between 4 and 15, the range is 15 − 4 = 11, not 14. So this case is impossible.
- x = 18 or x = 1.
Trap: finding only x = 18.
Try it. The list 5, 12, 9, x has a range of 10. What could x be?
Show the answer
- Without x: least 5, greatest 12.
- x greatest: x − 5 = 10, so x = 15.
- x least: 12 − x = 10, so x = 2.
- x in between: the range would be 12 − 5 = 7, not 10.
- x = 15 or x = 2.
Edge cases.
- The unknown can fit anywhere in between when the given range already equals the gap between the known extremes (see Check yourself).
- A range of 0 means every value is the same.
- A range smaller than the known gap is impossible: adding a value can't shrink the range.
Harder example. A = {3, 8, 12, x} and B = {5, 9, 20} have the same range. What are the possible values of x?
- Range of B: 20 − 5 = 15.
- Without x, A runs from 3 to 12, a gap of 9. So x must be a new extreme.
- x greatest: x − 3 = 15, so x = 18. x least: 12 − x = 15, so x = −3.
- x = 18 or x = −3.
Check yourself. The list 6, 2, 9, x has a range of 7. What could x be?
Check your answer
Without x the range is already 9 − 2 = 7. So any x from 2 to 9 inclusive works; anything outside makes the range larger.
Greatest or least possible value
To make one value as large as possible, make all the other values as small as the conditions allow. The mean fixes the total (mean × number of values). The median fixes the middle position. A unique mode must appear more often than any other value, so no other value may repeat as often. Whatever is left of the total goes to the value you want to make large.
Why it works. A fixed mean is a fixed budget (the total). Every unit you save on the other values can be spent on the one you want to be large, so push every other value to its limit first.
How to spot it: "greatest possible value", "least possible value", or "greatest possible range", together with a mean, a median or a mode.
Example. A list of 5 positive integers has a mean of 12, a median of 10, and exactly one mode, 4. What is the greatest possible value of the largest integer?
- Total: 5 × 12 = 60. In order, the 3rd value is the median, 10.
- The mode 4 must appear at least twice, and it is less than the median, so the 1st and 2nd values are 4 and 4.
- The 4th value is at least 10. It can't be 10: then 10 would appear twice, as often as 4, and 4 would not be the only mode. So the 4th value is 11.
- Largest value: 60 − (4 + 4 + 10 + 11) = 60 − 29 = 31.
- Check: 4, 4, 10, 11, 31 adds up to 60, has median 10, and 4 is the only value that appears twice ✓.
Trap: making the 4th value 10. That gives 32, but then 4 and 10 are both modes.
Try it. A list of 7 positive integers has a mean of 20, a median of 15, and exactly one mode, 6. What is the greatest possible value of the largest integer?
Show the answer
- Total: 7 × 20 = 140. The 4th value is the median, 15.
- Option 1: the mode 6 appears twice. The smallest value can then be 1, so use 1, 6, 6 below the median. After the median, 15 can't appear again and the next two values can't be equal, so use 16 and 17. The six values add to 1 + 6 + 6 + 15 + 16 + 17 = 61.
- Option 2: the mode 6 appears three times: 6, 6, 6, then 15, 15, 16 (15 may now appear twice). These add to 6 + 6 + 6 + 15 + 15 + 16 = 64.
- Option 1 uses less, so the largest value is 140 − 61 = 79.
- Check: 1, 6, 6, 15, 16, 17, 79 adds up to 140, the 4th value is 15, and only 6 appears twice ✓.
Edge cases.
- "Positive" means at least 1; "non-negative" allows 0; "different" forces the values apart.
- The least possible largest value is the opposite problem: make the values as equal as the rules allow.
Check yourself. Five different positive integers have a mean of 10. What is the greatest possible value of the largest?
Check your answer
Total: 50. The other four are as small as possible and different: 1 + 2 + 3 + 4 = 10. Largest: 50 − 10 = 40.
Median from a frequency table
In a frequency table, each value comes with its frequency (how many times it appears). Add the frequencies to get n, the number of values. Find the middle position or positions. Then go down the table, keeping a running total, to see which value sits in that position.
Why it works. A frequency table is a sorted list written in short form: "7 students scored 2" stands for seven 2s in a row. The running totals show which value fills each position.
How to spot it: a table of values and how many times each one occurs.
Example. On a quiz, 4 students scored 1, 7 scored 2, 5 scored 3 and 4 scored 4. What is the median score?
| Score | Students | Positions in the sorted list |
|---|---|---|
| 1 | 4 | 1st to 4th |
| 2 | 7 | 5th to 11th |
| 3 | 5 | 12th to 16th |
| 4 | 4 | 17th to 20th |
- n = 4 + 7 + 5 + 4 = 20, an even number, so the median is the average of the 10th and 11th scores.
- From the table, the 10th and 11th scores are both 2.
- Median: (2 + 2) ÷ 2 = 2.
Trap: taking the median of the four score values 1, 2, 3 and 4 (which gives 2.5) and ignoring how many students got each score.
Edge cases.
- Odd n has one middle position, (n + 1) ÷ 2.
- The middle pair can fall on two different values, for example the last 2 and the first 3. Then average them.
- The mean from a table is (each value × its frequency, added up) ÷ n. The mode is the value with the highest frequency, not the frequency itself.
Harder example. In a survey, 3 people gave a rating of 0, 5 gave 1, 6 gave 2 and x gave 3. The median rating is 2. What is the least possible value of x?
- The 2s fill positions 9 to 14 (after 3 + 5 = 8 lower ratings). The median must fall in that block.
- n = 14 + x. Try x = 2: n = 16, so the median is the average of the 8th and 9th ratings, 1 and 2: 1.5 ✗.
- Try x = 3: n = 17, so the median is the 9th rating, which is 2 ✓.
- The least possible value is x = 3.
Check yourself. What is the mean score in the quiz table above?
Check your answer
(1 × 4 + 2 × 7 + 3 × 5 + 4 × 4) ÷ 20 = (4 + 14 + 15 + 16) ÷ 20 = 49 ÷ 20 = 2.45.
The range of combined data sets
The range of two data sets put together is the larger of the two maximums minus the smaller of the two minimums. If a set is described by its minimum (or maximum) and its range, find the other end first: maximum = minimum + range.
Why it works. Combining the sets doesn't create new values, so the combined least value is whichever set's least value is smaller, and the combined greatest value is whichever greatest value is larger.
How to spot it: "data set B has a minimum of … and a range of …", "the two data sets are combined".
Example. Data set A is 23, 24, 38, 60, 67, 79. Data set B has a minimum of 18 and a range of 11. What is the range of the combined data?
- B's maximum: 18 + 11 = 29.
- Combined minimum: the smaller of 23 and 18 is 18. Combined maximum: the larger of 79 and 29 is 79.
- Range: 79 − 18 = 61.
Trap: adding the ranges, 56 + 11 = 67. The sets overlap, so that counts the shared stretch twice.
Edge cases.
- One set inside the other: if B runs from 30 to 60 and A from 23 to 79, the combined range is just A's, 56.
- Sets far apart: if B runs from 100 to 110, the combined range is 110 − 23 = 87, more than the two ranges added (56 + 10 = 66).
- Other measures: the combined mean needs both sizes (a weighted average), and the combined median needs the actual values.
Check yourself. Data set A has values from 12 to 40. Data set B has a maximum of 52 and a range of 30. What is the range of the combined data?
Check your answer
B runs from 52 − 30 = 22 to 52. Combined: from 12 to 52, a range of 40.
How hard questions disguise it
For harder questions (L4–L5)
L4 versions ask what must be true when one value changes, or add an unknown that could land anywhere in the list. At L5, median and range combine with means (removing an outlier moves the mean but maybe not the median) and with standard deviation (which change moves the spread but not the center). Sort, mark the middle position, and test the extreme placements of any unknown.
Practice
Practice median, mode and range questions in timed sets on the median and range practice page.
Common traps
Assuming the median always (or never) moves
Removing an extreme value always moves the mean toward the other values. The median moves only if the middle of the list changes: check the middle values before and after.
Adding the ranges of two data sets
The range of the combined data is the larger maximum minus the smaller minimum. Find each set's minimum and maximum; the two ranges usually overlap.
Not sorting first
The median is the middle of the SORTED list. Rewrite the list in order before you pick the middle.
Using the wrong middle position
With n values the median sits at position (n + 1) ÷ 2; with an even count, average the two values on either side of that position. Report the value there, not the position number.
Mixing up mean, median and mode
The mean adds and divides, the median locates the middle, and the mode is the most frequent value. (Greatest + least) ÷ 2 is none of them, so read which measure the question names.
Answering the range, or the old range
Range is greatest minus least, a measure of spread, not of the center. When an unknown joins the list, the question usually wants the unknown, not a range.
Assuming an unknown value sits in one place
An unknown x could be the new greatest or least value, which changes the range and the median. Test each possible position and check the condition each time.
Stopping before isolating the unknown
If x and 12 are the two middle values and the median is 10, then x + 12 = 20 and x = 8. Write the equation the condition gives, then finish solving it.
Reading a frequency table wrong
In a frequency table the counts tell you how many times each value occurs. The mode is the value with the largest count, and the median is found by walking through the counts to the middle position.
Breaking a condition while shrinking the other values
Make the other values as small as possible, but keep every condition: positive integers start at 1, the median keeps its place, and no other value may appear as often as a unique mode.
Moving the median with a frequency table
For the median to reach v, the values of v or more must outnumber the rest by at least one. Count what's already there, add just enough, and check the middle position lands on v.
Assuming the median stays put when a value is added
Adding one value to a list of odd length makes the count even, so the new median is the average of the two middle values. It moves toward the new value unless the new value equals the old median.