SAT Math lesson · Averages
SAT averages: the mean, weighted averages and means from frequency charts
How to solve SAT mean questions with sums: missing values, a value that changes the mean, weighted groups, evenly spaced lists and the mean of data shown in a frequency table or bar graph.
The core idea
An average is a total in disguise: sum = mean × count. Convert every average to a sum, do the arithmetic on sums, and convert back only at the end; for groups of different sizes, weight each average by its group size.
Core ideas
Words used here
- Mean, or average: add up the values, then divide by how many values there are.
- Sum, or total: all the values added together.
- Count: how many values there are.
- Weighted average: the average of a combined group, where a bigger group counts more.
- Evenly spaced list: each value is the same amount more than the one before, such as 12, 18, 24, 30. It is also called an arithmetic sequence.
- Inclusive: "from 12 to 96, inclusive" means 12 and 96 are both in the list.
- Inverse ratio: a ratio turned around. The inverse of 2 : 3 is 3 : 2.
- Sum = mean × count. For example, if 4 numbers average 10, they add up to 4 × 10 = 40. This one equation solves almost every average question.
- Adding or removing a value: compare the old sum and the new sum. The difference is the value that was added or removed.
- Weighted average of two groups = (n₁ × a₁ + n₂ × a₂) ÷ (n₁ + n₂), where n₁ and n₂ are the group sizes and a₁ and a₂ are their averages. The answer is always between a₁ and a₂, and closer to the bigger group.
- Group sizes and distances: the group sizes are in the inverse ratio of each group's distance from the combined average (see the example below).
- Evenly spaced lists: mean = (first + last) ÷ 2. This is also the median, the middle value.
On the SAT.
- Wording: the SAT writes "mean"; "average" in a question also means the mean.
- Data displays: SAT means often come from a frequency table, a dot plot or a bar graph of frequencies. Count each value as many times as it appears.
- Calculator: the graphing calculator handles totals such as 8 × 23.5; converting to totals is still the fast route.
- Typed answers: type the exact value (37.5, not 38) unless the question asks you to round.
Try it. A team of 6 players has an average height of 180 cm. A new player who is 194 cm tall joins. What is the new average height?
Show the answer
- Old total: 6 × 180 = 1,080 cm.
- New total: 1,080 + 194 = 1,274 cm.
- New count: 6 + 1 = 7 players.
- New average: 1,274 ÷ 7 = 182 cm.
Sum equals mean times count
When a question gives an average and asks about one of the values, change the average into a total (sum = mean × count). Subtract the values you know. What is left belongs to the unknown value.
Why it works. The mean is the total shared out equally: 4 numbers with mean 10 behave, in total, like four 10s. Multiplying the mean by the count puts the total back together, and totals are what actually add and subtract when values come and go.
How to spot it: "the average of n numbers is…" together with a missing value or a target average.
Example. Ravi's first four quiz scores are 72, 85, 90 and 78. What must he score on the fifth quiz to average 82?
- Total needed for 5 quizzes: 5 × 82 = 410.
- Total so far: 72 + 85 + 90 + 78 = 325.
- Fifth score: 410 − 325 = 85.
Overlapping groups work the same way. Days 1–4 average 20°, days 4–7 average 23°, and all 7 days average 21°. What was the temperature on day 4?
- Days 1–4 total: 4 × 20 = 80. Days 4–7 total: 4 × 23 = 92.
- All 7 days total: 7 × 21 = 147.
- 80 + 92 = 172 counts day 4 twice, so day 4 = 172 − 147 = 25°.
Trap: answering 82, the target average, as if the missing score had to equal it.
Edge cases.
- Zero and negative values count. The mean of 0, 0, 9 is 3, not 9 ÷ 1.
- A target can be out of reach. If Ravi needed 410 points but quizzes stop at 100 and he had only 300, no fifth score would do.
- "At least" an average means the total must be at least mean × count.
Harder example. The average of 6 numbers is 15. The average of the first 4 is 12, and the 5th number is 8 more than the 6th. What is the 6th number?
- Total of all 6: 6 × 15 = 90. Total of the first 4: 4 × 12 = 48.
- The last two add to 90 − 48 = 42.
- Call the 6th number x. Then the 5th is x + 8, and x + (x + 8) = 42.
- So 2x = 34 and x = 17 (the 5th is 25).
- Check: 48 + 25 + 17 = 90, and 90 ÷ 6 = 15 ✓.
Check yourself. Five numbers average 30. One of them, 50, is replaced by 20. What is the new average?
Check your answer
Old total: 150. New total: 150 − 50 + 20 = 120. New average: 120 ÷ 5 = 24.
A new value changes the mean
Find the sum before and the sum after. The difference is the value that was added or removed. Remember that the count also changes by one.
Why it works. A new value equal to the mean leaves the mean where it is. A new value above the mean shares its extra amount among all the values: the mean rises by (new value − old mean) ÷ (new count). Below the mean, it falls the same way.
How to spot it: "when one more number is added…", "if one value is removed, the average becomes…".
Example. The average of 8 numbers is 20. One number is removed, and the average of the other 7 numbers is 19. What number was removed?
- Old sum: 8 × 20 = 160.
- New sum: 7 × 19 = 133.
- Removed number: 160 − 133 = 27.
Correcting a value is the same idea. One of 8 readings was written as 52 but should be 60. The correct total is 60 − 52 = 8 higher, so the mean rises by 8 ÷ 8 = 1.
Trap: subtracting the averages (20 − 19 = 1). Removing one number changes the count too, so you must compare totals.
Explore. Drag the orange value. The mean moves every time, by the change ÷ 5. The median moves only when the value crosses the middle. Adding the same number to every value moves the mean by that number.
Sorted: 4, 6, 7, 9, 14 (5 values).
Mean = 40 ÷ 5 = 8. Median = 7. Range = 14 − 4 = 10. SD ≈ 3.41.
Move the orange value: the mean moves every time, the median moves only if the value crosses the middle, and the SD grows as the value moves away from the mean.
Add the same number to every value: the mean and median move by that number; the range and SD stay the same.
Edge cases.
- Changing one value by k changes the mean by k ÷ n. The count stays the same.
- Removing a value equal to the mean leaves the mean unchanged.
- Adding and removing at once: compare the totals, and use the new count.
Harder example. The average of a list of numbers is 24. When the number 60 is added, the average becomes 27. How many numbers were in the list at first?
- Call the first count n. Old total: 24n. New total: 24n + 60, with n + 1 numbers.
- 24n + 60 = 27(n + 1) = 27n + 27.
- So 60 − 27 = 3n, and n = 11.
- The shortcut agrees: 60 is 36 above the old mean, and that extra raised the mean by 3, so it was shared by 36 ÷ 3 = 12 numbers, meaning 11 at first.
- Check: 11 × 24 = 264, and (264 + 60) ÷ 12 = 324 ÷ 12 = 27 ✓.
Check yourself. The mean of 9 numbers is 50. A 10th number raises the mean to 52. What is the 10th number?
Check your answer
New total: 10 × 52 = 520. Old total: 9 × 50 = 450. The 10th number is 70.
Weighted average of groups
A weighted average is the average of a combined group when the groups have different sizes. Multiply each group's average by its size, add the results, and divide by the total number of people.
Why it works. Every person counts once, so a bigger group adds more points to the total. Averaging the two group averages treats a group of 20 as if it were as big as a group of 30.
How to spot it: two or more groups of different sizes, each with its own average.
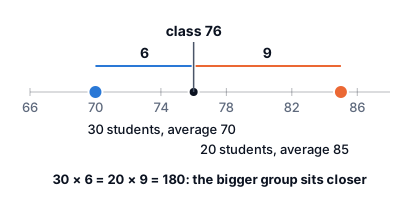
Example. In a class, 30 students averaged 70 on a test and 20 students averaged 85. What was the class average?
- Points from group 1: 30 × 70 = 2,100. Points from group 2: 20 × 85 = 1,700.
- Total points: 2,100 + 1,700 = 3,800.
- Total students: 30 + 20 = 50.
- Class average: 3,800 ÷ 50 = 76.
The distance check. The average 76 is 76 − 70 = 6 from the first group and 85 − 76 = 9 from the second. The group sizes are these distances turned around (the inverse ratio): size 1 : size 2 = 9 : 6 = 3 : 2. And 30 : 20 is also 3 : 2. ✓ The bigger group is closer to the combined average. Harder questions give you the combined average and ask for the ratio of the groups, so this check works in reverse.
Trap: (70 + 85) ÷ 2 = 77.5. This treats the two groups as if they were the same size.
Try it. 40 workers earn an average of $15 an hour, and 10 workers earn an average of $20 an hour. What is the average for all 50 workers?
Show the answer
- Total pay per hour: 40 × 15 = 600 and 10 × 20 = 200, so 600 + 200 = 800.
- Average: 800 ÷ 50 = $16.
- Distance check: 16 is 1 from 15 and 4 from 20. Sizes 4 : 1 match 40 : 10. ✓
Edge cases.
- Equal group sizes: the plain average of the averages is right.
- Weights as percents work too. If 60% of a class averages 80 and 40% averages 90, the class average is 0.6 × 80 + 0.4 × 90 = 84.
- Three or more groups: the same formula, with one more term on top and on the bottom.
Harder example. At a company, managers earn an average of $90,000 and all other staff an average of $50,000. The average for everyone is $60,000. What percent of the staff are managers?
- Distances from the overall average: managers 90,000 − 60,000 = 30,000; others 60,000 − 50,000 = 10,000.
- The sizes are in the inverse ratio: managers : others = 10,000 : 30,000 = 1 : 3.
- Managers are 1 of every 4 people: 25%.
- Check with 4 people: (90,000 + 3 × 50,000) ÷ 4 = 240,000 ÷ 4 = 60,000 ✓.
Check yourself. 60% of a class averaged 80 on a test and the rest averaged 90. What was the class average?
Check your answer
0.6 × 80 + 0.4 × 90 = 48 + 36 = 84. It is closer to 80, because more students are in that group.
Mean of an evenly spaced list
In an evenly spaced list (an arithmetic sequence), each value is the same amount more than the one before. Consecutive integers (such as 5, 6, 7, 8) and "all multiples of 6 from 12 to 96" are evenly spaced. The mean of such a list is simply (first + last) ÷ 2, so you never need to add every term.
Why it works: pair the first and last values, then the second and second-to-last, and so on. Every pair has the same sum, so the average is half of that sum.
How to spot it: "consecutive", "all multiples of k from… to…", "each term is d more than the one before".
Example. What is the average of all multiples of 6 from 12 to 96, inclusive?
- The list is 12, 18, 24, …, 90, 96. Each term is 6 more than the one before, so it is evenly spaced.
- Pairs: 12 + 96 = 108, 18 + 90 = 108, and so on.
- Average = 108 ÷ 2 = 54.
If a question asks for the sum instead: the number of terms is (96 − 12) ÷ 6 + 1 = 14 + 1 = 15, so the sum is 54 × 15 = 810.
Trap: computing the sum or the number of terms and reporting that instead of the average.
Edge cases.
- Negative numbers are fine. The integers from −7 to 13 have mean (−7 + 13) ÷ 2 = 3.
- The list must be evenly spaced. For 1, 4, 9, 16 (squares), (1 + 16) ÷ 2 = 8.5 is wrong; the mean is 30 ÷ 4 = 7.5.
- With an even number of terms, the mean sits between the two middle terms and may not be in the list.
Harder example. The sum of 15 consecutive integers is 405. What is the largest of them?
- Mean: 405 ÷ 15 = 27.
- In an evenly spaced list with an odd count, the mean is the middle term. The 8th of 15 terms is 27.
- There are 7 terms after the middle one, each 1 more: 27 + 7 = 34.
- Check: the integers are 20 to 34, and 15 × (20 + 34) ÷ 2 = 15 × 27 = 405 ✓.
Check yourself. What is the mean of the odd integers from −9 to 21, inclusive?
Check your answer
They are evenly spaced, so the mean is (−9 + 21) ÷ 2 = 6.
The mean from a frequency table or bar graph
When data are shown by frequency (a table of values and counts, a dot plot, or a bar graph whose bar heights are counts), the mean is the sum of each value times its frequency, divided by the total frequency.
Why it works. A bar of height 8 above the value 2 stands for eight 2s in the data. Multiplying 2 × 8 adds all eight at once, and the number of values is the sum of the bar heights.
How to spot it: "the bar graph shows the number of students who …", a frequency table, a dot plot; "what is the mean of the data?"
Example. A bar graph shows how many pets each of 20 households has: 0 pets: 2 households, 1 pet: 5, 2 pets: 8, 3 pets: 3, 4 pets: 2. What is the mean number of pets?
- Total pets: 0 × 2 + 1 × 5 + 2 × 8 + 3 × 3 + 4 × 2 = 0 + 5 + 16 + 9 + 8 = 38.
- Number of households: 2 + 5 + 8 + 3 + 2 = 20.
- Mean: 38 ÷ 20 = 1.9 pets.
Trap: averaging the bar heights (20 ÷ 5 = 4) or the values 0 to 4 once each ((0 + 1 + 2 + 3 + 4) ÷ 5 = 2). Neither weights the values by how often they occur.
Edge cases.
- The median of the same data is the middle value in order, here the 10th and 11th of 20: both are 2, so the median is 2.
- The mode is the value with the tallest bar (2 here), which is a different measure.
- Grouped data (a histogram with ranges such as 10–19) gives only an estimate of the mean; the SAT asks about it in words, not with exact arithmetic.
Check yourself. A frequency table shows the quiz scores of 10 students: score 6, frequency 3; score 8, frequency 5; score 10, frequency 2. What is the mean score?
Check your answer
(6 × 3 + 8 × 5 + 10 × 2) ÷ 10 = (18 + 40 + 20) ÷ 10 = 7.8.
How hard questions disguise it
For harder questions (L4–L5)
L4 questions hide the group sizes: "the class average is 76; what is the ratio of boys to girls?" asks you to reverse the weighted average with the distance check. L5 questions combine averages with percents (everyone gets a 5% raise, then someone leaves), with data displays (a bar graph of frequencies hides the weights), or with median and range (a list with a fixed mean and a condition on the median). In each case, write the total first, apply every change to the total, and divide only at the end.
Practice
Build speed on these patterns with timed sets on the averages practice page.
Common traps
Averaging the bars instead of the data
In a bar graph of frequencies, each value counts as many times as its bar is tall. Multiply each value by its frequency, add, and divide by the number of values, not by the number of bars.
Working with averages instead of sums
Averages don't add, subtract or average the way totals do, and an average is not any single value. Turn every average into a sum first, then compare sums.
Averaging averages of unequal groups
A group of 30 and a group of 10 don't count equally. Weight each average by its own group's size; the combined average must land between the two.
Stopping at a total or a partial adjustment
The sum is a step, not the answer. After finding it, finish the subtraction or division the question needs, and make sure a new value covers every earlier shortfall, not just one.
Using the wrong number of values
When a value is added or removed, the count changes by one, and overlapping groups share a member. Write each count next to its average before multiplying.
Flipping the weighted-average ratio
The combined average sits closer to the bigger group, so each group's size matches the other group's distance. Check that your ratio pulls the average toward the larger group.
Placing the mean or the ends of an evenly spaced list wrong
The mean of an evenly spaced list sits exactly in the middle, so the greatest value is half the spread above it. Find the middle first, then step out to the end the question asks about.
Converting between totals and averages wrong
Total = average × count, and a change of c in the total moves the average by c ÷ count in the same direction. Multiply to get totals; divide to get averages.
Answering the median instead of the mean
The median is the middle value after sorting; the mean is the total divided by the count. Read which one the question names.
Packing values wrong under a median constraint
To make the largest of several different integers as big as possible with a fixed mean and median, make the values below the median as small as possible (1, 2, …) and the values above it just one more than the median.
Leaving a value out of the total
Every value in the list belongs in the sum. Before you divide or subtract, check that your total uses each number once.
Correcting a recorded value only halfway
To fix a value that was recorded wrong, take the wrong value out of the total and put the true value in. The count of values stays the same.
Using the wrong average for a group
Each average belongs to one group at one moment. The original members use their own average, and newcomers are compared with the new average, so write each average next to its group before you subtract.
Mishandling bounds on an average
'The average is greater than 20 and less than 24' bounds the total, not the unknown: with four numbers the total is between 80 and 96. Subtract the known values, and keep the strict inequalities strict.